


One of the things that the keen solar power system owner is going to do is to compare what their system says it is generating and what the electricity retailer is paying you for the power you feed in to the grid.
If you choose right, then you will have a system that gives you plenty of information about not only what you generate, but what you use of that generated power, what you export to the grid, and what you import from the grid. I recently got a SolarEdge solar panel system on my roof, so that is a company which supplies a great advantage in the information that it supplies its users.
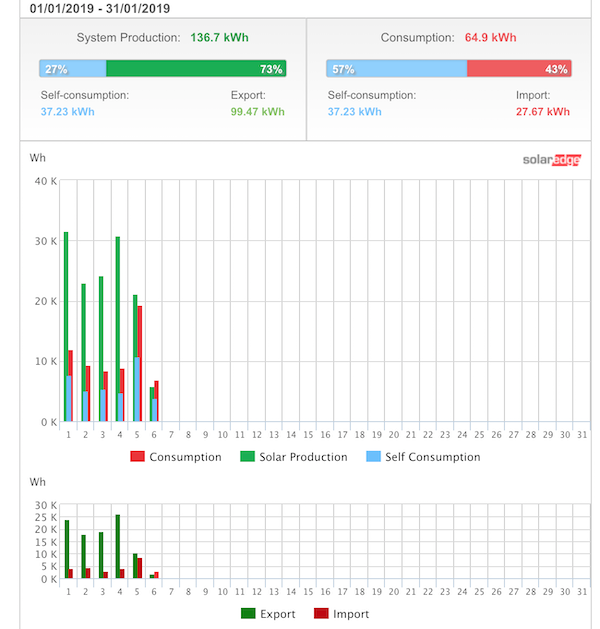
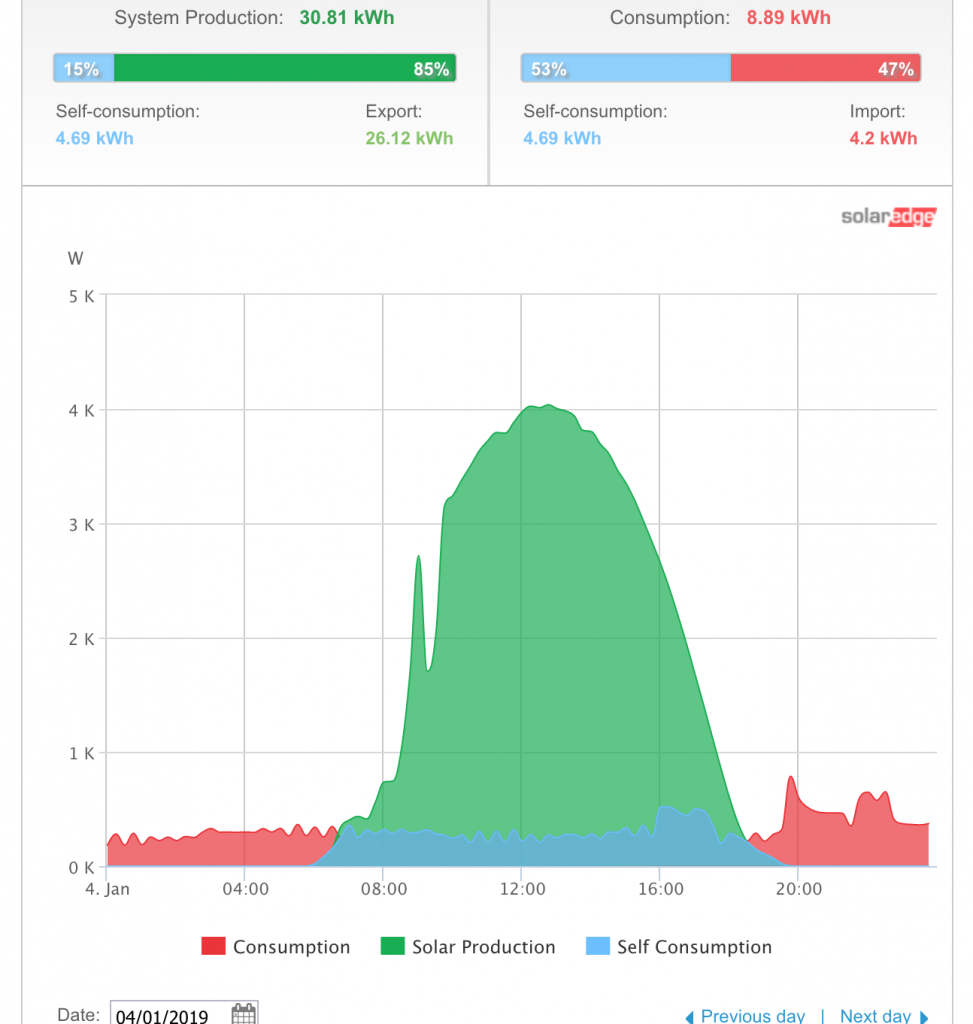
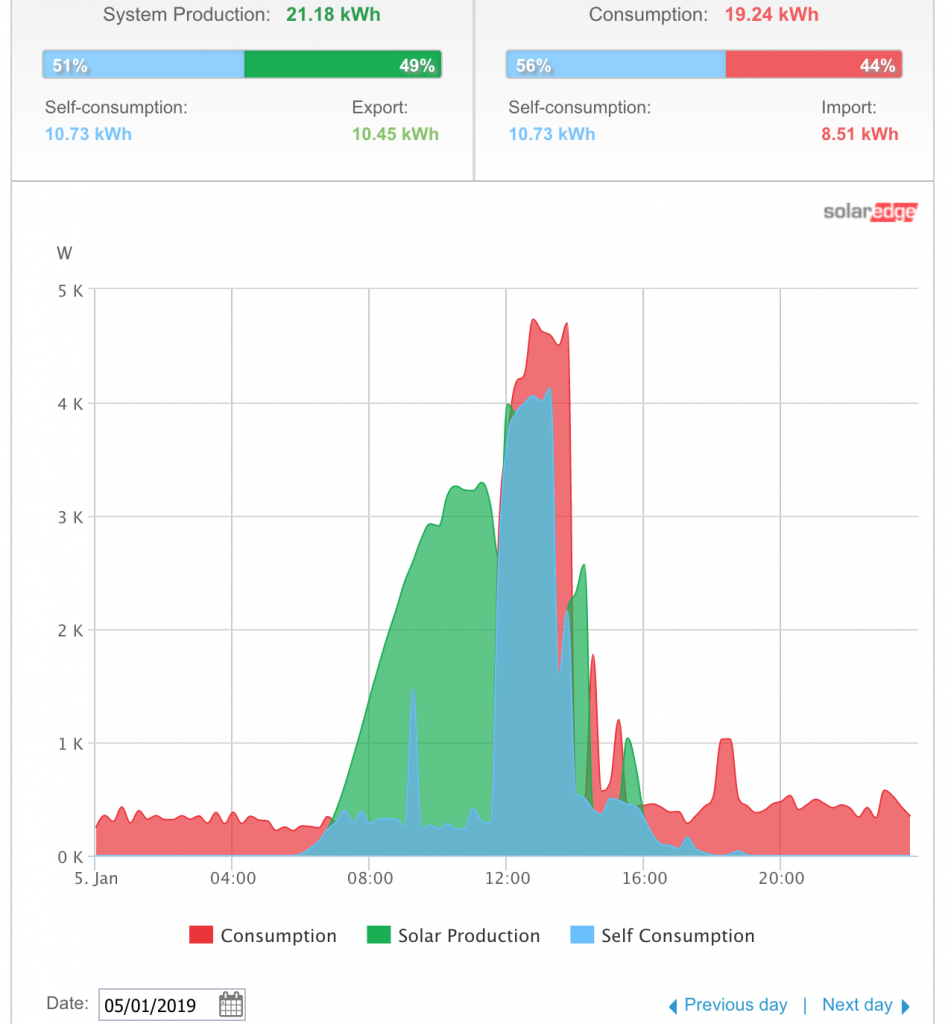
As you can see, in January in Sydney so far we’ve had a couple of very sunny days and a couple of gloomy ones. But still over the 6 days, we have produced way more than we imported from the grid and…………
Off peak power may not be the blessing it used to be
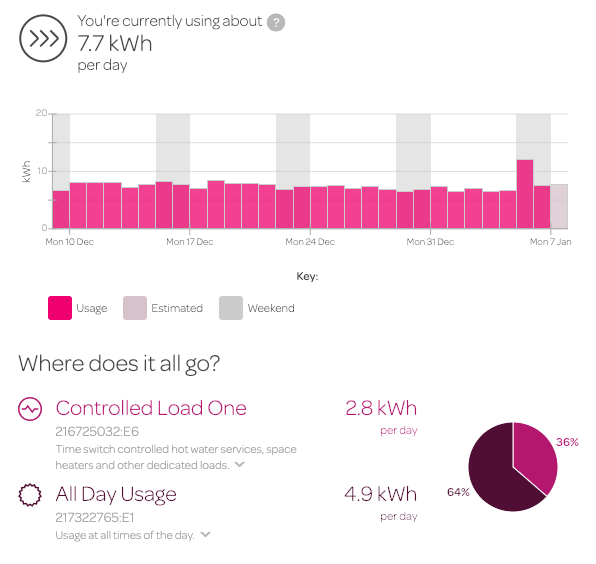
At first it seemed remarkable that despite the power produced, there was a baseline of about 6 to 7 kWh per day that could not be gotten below. The thing was that about 3kWh of consumption was pre-ordained by the controlled load that was largely used by our hot water heater in the wee hours of the morning. We are still paying more per kWh at that time than we get back in feed-in tariff rates from our retailer in the hours when the sun is shining. So the question poses itself, would we be better off changing our hot water heating hours to the day rather than the darkest hours for the night time?
When we went on vacation in mid January, we switched off the hot water circuit. That move reduced that baseline consumption down to 3kWh.
Time shifting of appliance use
Baseline consumption
Energy hogging appliances
Smart meter
I was able to review my account after the smart meter install. It looked like for a period that the power metering was inaccurate. I contacted Powershop and they said that the meters were read correctly, and that they have photographic evidence.
The next question that I asked: “Is this a meter misread or is it possible that the setup of the solar power system was incorrect?”.
The electrician who had installed the solar had expressed bemusement why on a bright sunny day, the wheel on the old non-smart meter wasn’t going backwards.
Measuring solar going out as going in
I followed up with Bradford CSR, the reputable company who did the installation of the solar power system. Their After Sales Engineer said that this is a classic problem when there is no net or smart meter. An analog meter measures current no matter which direction it is going in. It then adds up both imported and exported kWh. The effect is of apparent high usage while the old analog meter was in place for the 14 days after solar installation.
So, not only was there a charge for the electricity imported, there was a charge for that exported. As well as not getting the Feed-in tariff that I’d be entitled to. That can really be the only explanation for the anomaly in the solar power system performance.