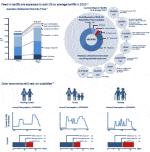
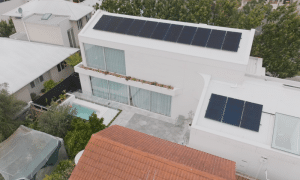
Household PV subsidies have had only a minor impact on household electricity bills; “so why the political angst?” asks Exigency. The following is an infographic provided by the company.
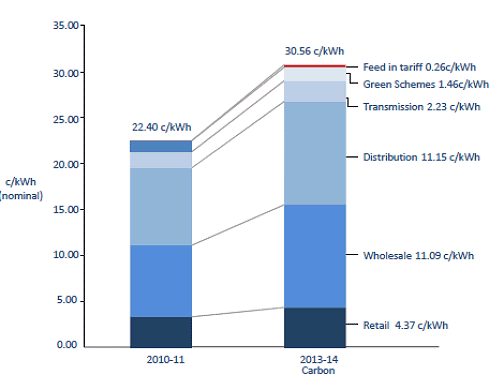
Feed In tariffs are expected to add 1% to average tariffs in 2013
Australian Residential Electricity Prices 1
Current Feed In Tariffs As at January 2012 2
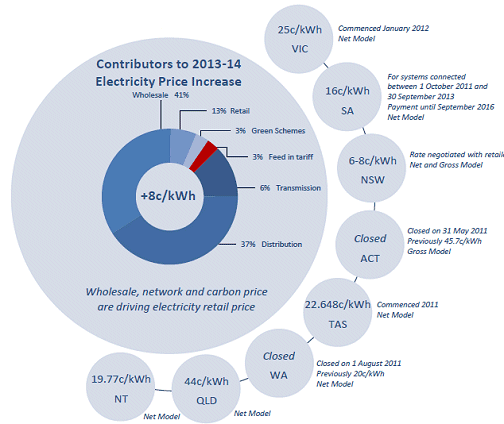
(Added note from EM: ACT residents connecting solar panels to the grid are now paid the market rate for their electricity by ACTEW. New connections in Western Australia are paid anywhere from 8c to 50c per kilowatt hour depending on location. In South Australia, electricity retailers will be paying 9.8c per kilowatt hour in addition to the 16c from July 2012.)
Solar economics still rely on subsidies 3
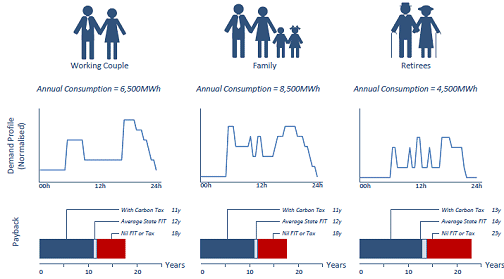
The FiT effect is to turbo charge installations providing supply when demand is highest
Small Solar Installations 5
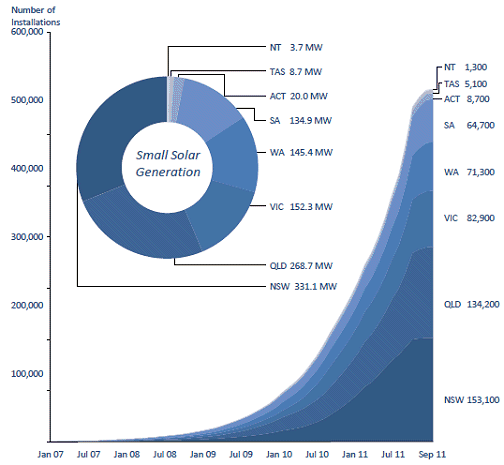
(Added note from EM: 665,215 solar power systems for which certificates have been registered were installed between 2001 to the end of March this year)
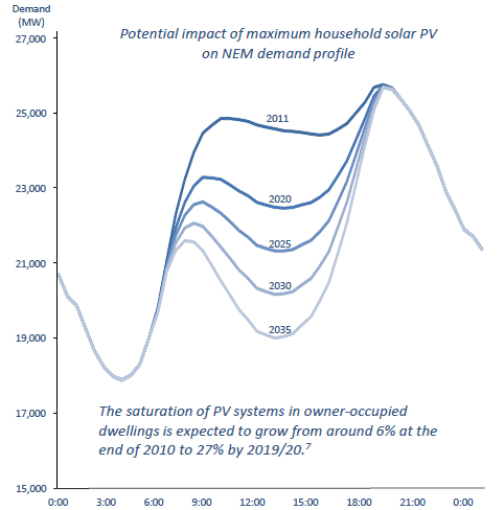
ECON101: Solar Supply and Grid Demand 6
The full Exigency infographic can be viewed here (PDF). Exigency is an authority on Australian energy markets with reach to Asia Pacific, Europe and North America. In February, Exigency provided the Victorian Competition and Efficiency Commission with a submission to their Inquiry into Feed-in Tariffs, providing insight to both the impact of feed-in tariffs and methods for overcoming two major barriers to distributed generation..
Infographic Authors: Bruce Macfarlane, Adrian Palmer, Stuart Allinson – www.exigency.com.au
Infographic sources:
1. Carbon Scenario Prices, AEMC Future Retail Electricity Price Movements, Nov 2011.
2. Feed-in tariffs, Parliamentary Library, Parliament of Australia Web Site.
3. Exigency estimates of household demand and profiles. Payback periods were estimated based on solar production, standing tariffs and FIT by state.
4. CEC Consumer Guide to Buying Household Solar Panels, August 2011.
5. ORER Data to September 2011.
6. Exigency analysis based on annualised installation rate of 200,000 1.5kW solar PV, future profiles normalised to 2011 NEM average demand profile, NEM growth rate assumed of 2% based on ABARE forecasts.
7. AEMC, Interim Report, Impact of the enhanced Renewable Energy Target on energy markets, 25 November 2011. Note ABS reports that in 2006, there were a total of 7.8 million households in Australia. By 2031, the number of households isprojected to grow to between 11.4 and 11.8 million.


