


When climate change makes the news, the focus often falls on big industries: power stations, airlines, or large-scale agriculture. These sectors are undeniably responsible for a significant share of global greenhouse gas emissions. Yet the truth is more complex. A large proportion of carbon emissions comes from the combined weight of ordinary, everyday actions: the way we live, move, eat, and shop.

On this page


Did you know Energy Matters is Australia’s largest renewable news, blog and educational resource? Subscribe to Energy Matters’ weekly newsletter and keep updated even with incentives, rebates and recommended solar product offers.
Energy use in the home
The home is one of the largest contributors to household emissions. Electricity, heating, cooling, and hot water are so embedded in daily life that their impact often goes unnoticed. In Australia, residential energy use accounts for around 10% of direct national emissions, but the true figure is higher once upstream emissions from fuel extraction and electricity generation are included.
Electricity consumption
Electricity is the backbone of modern living, yet its carbon cost depends heavily on how it is generated. In coal-dependent states such as Victoria (VIC), each kilowatt-hour (kWh) used produced about 900 grams of carbon dioxide. In contrast, Tasmania’s (TAS) hydro-powered grid produces less than 200 grams per kWh. This means that running the same 2 kWh appliance (e.g. clothes dryer) creates four to five times more emissions in one state than another.
Appliances vary greatly in energy demand. A fridge running continuously may use 1-2 kWh a day, while a split-system air conditioner can consume than in an hour. Devices left on standby, though individually minor, collectively contribute significantly when multiplied across households.
Heating and cooling
Heating and cooling represent the single largest share of energy use in Aussie homes, often around 40%. The emissions depend on the fuel type and building efficiency. Gas heaters, electric resistance heaters, and inefficient air conditioners all drive high energy use, particularly in poorly insulated homes.
The inefficiency of the building envelope matters as much as the heater itself. A home with minimal insulation or single-glazed windows leaks warm or cool air, forcing systems to work harder. As a result, households use more energy, incur higher bills, and emit more carbon for the same comfort level.
Water heating
Water heating typically ranks second in household energy use after heating and cooling. Hot showers, dishwashers, and washing machines all draw heavily on energy, particularly when hot water tanks are old or uninsulated. In many homes, water heating alone accounts for up to 20-25% of total energy consumption.
For perspective: heating 50 litres of water for a single shower consumes 2.5 kWh, creating around 2 kg of CO2 emissions in a coal-reliant state. Daily long showers can therefore rival or even exceed the footprint of major appliances like fridges or ovens.
Carbon impact of common household activities
Activity | Energy Used | Emissions (coal-heavy grid e.g. VIC) | Emissions (renewables-heavy grid e.g. TAS/SA) | Notes |
1 hour of clothes dryer use | ~2.0–2.5 kWh | 1.8–2.2 kg CO₂ | 0.4–0.5 kg CO₂ | Dryers are among the most energy-intensive appliances; line drying = 0. |
10-minute hot shower (50L, electric storage heater) | ~2.5 kWh | ~2.3 kg CO₂ | ~0.5 kg CO₂ | Water heating is often the 2nd-largest household energy load. |
Running a dishwasher (hot cycle) | ~1.5 kWh | ~1.3 kg CO₂ | ~0.3 kg CO₂ | Using eco/warm cycles reduces the footprint. |
1 split-system air conditioner (1 hour, 2.5kW unit) | ~2.0 kWh | ~1.8 kg CO₂ | ~0.4 kg CO₂ | Poor insulation increases usage significantly. |
1 fridge (daily average) | ~1.0–1.5 kWh | ~0.9–1.3 kg CO₂ | ~0.2–0.3 kg CO₂ | Continuous background load; efficient models use less. |
TV + gaming console (2 hours) | ~0.5–0.8 kWh | ~0.45–0.7 kg CO₂ | ~0.1–0.2 kg CO₂ | Standby mode adds an annual hidden load. |
Laptop (5 hours use) | ~0.2 kWh | ~0.18 kg CO₂ | ~0.04 kg CO₂ | Low per-use impact but significant across millions of households. |
LED lighting (10 bulbs for 5 hours) | ~0.5 kWh | ~0.45 kg CO₂ | ~0.1 kg CO₂ | 80–90% less than halogen equivalent. |
Transport and mobility
Transport is one of the most visible sources of everyday carbon emissions. It contributes to about 19% of national emissions in Australia, with cars responsible for the majority. The way we move, whether driving solo, catching a bus, or boarding a flight, makes a big difference to our personal carbon footprint.
Cars: The daily driver of emissions
Private cars dominate Australian transport. A typical petrol car emits about 2.3 kg of CO2 for every litre of fuel burned. For the average car, that works out to roughly 180-250 grams of CO2 per kilometre. Short trips are especially polluting, since cold engines run less efficiently and require more fuel per kilometre.
Think of it this way:
- A 5 km school run in a petrol car = about 1 Kg of CO2.
- Repeat that twice a day for a year, and you’ve emitted over 350 kg of CO2 from school drop-offs alone.
Public transport: Shared journeys, smaller footprints
Buses and trans produce emissions too, but the difference lies in how they’re shared. A full commuter train spreads its emissions across hundreds of passengers, cutting the average footprint per person to a fraction of that from cars. Even diesel buses, when well used, can reduce per-passenger emissions by more than half compared to single-occupancy car trips. As Australia’s public transport systems transition to electric fleets, these benefits will grow.
Air travel: One of the heaviest hitters
Flying is the most carbon-intensive transport option on a per-kilometre basis. A Sydney-Melbourne return flight emits around 300 kg of CO2 per passenger, equivalent to driving a medium petrol car for more than 1,500 km. The impact grows significantly for long-haul international flights. For frequent flyers, aviation can dominate their entire annual carbon footprint.
EVs and the shift to cleaner mobility
Electric vehicles don’t eliminate emissions, but they shift them to the electricity grid. On a coal-heavy grid, an EV may still produce around 100 g CO2 per kilometre. On a renewables-rich grid, that number falls close to zero. As Australia continues its transition to renewable electricity, EVs will become a critical way to cut transport emissions without changing driving habits.
Food systems and diet
The food we eat has one of the biggest but least visible carbon footprints in daily life. Agriculture, processing, packaging, and transport all contribute to emissions, and the impact varies dramatically depending on what ends up on our plate. Globally, food systems account for about one-third of greenhouse gas emissions, and in Australia, diet-related emissions are estimated to make up around 25-30% of a household’s carbon footprint.
Meat and dairy
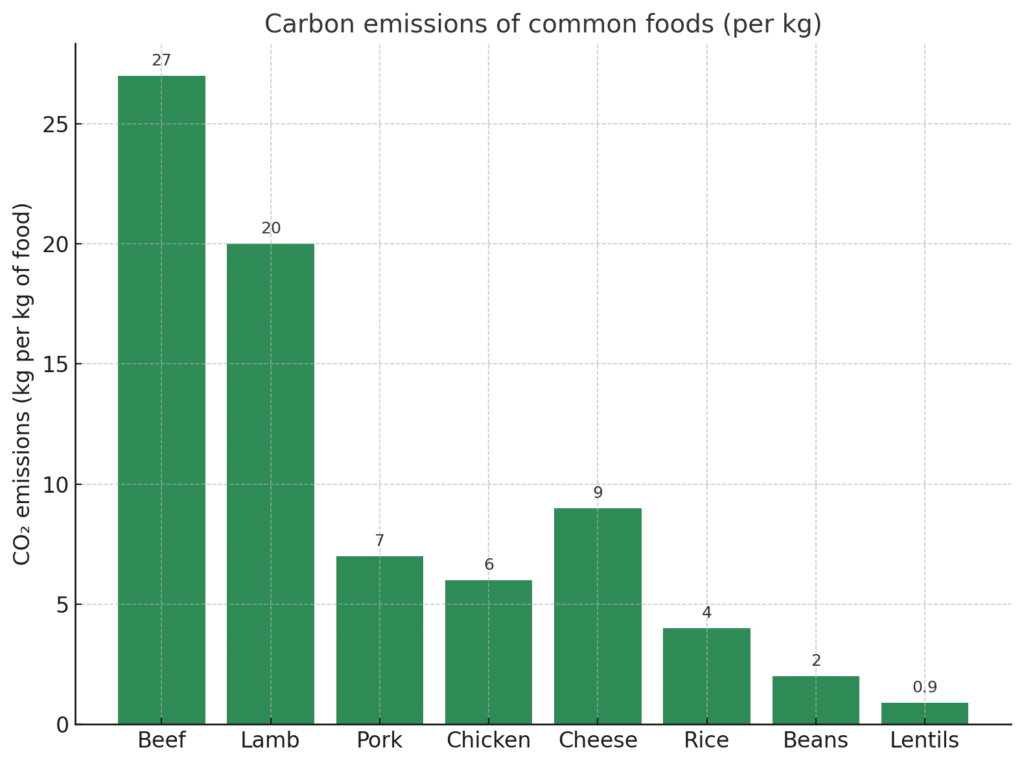
Animal products, particularly red meat, are the most carbon-intensive foods. Livestock such as cattle produce methane (a greenhouse gas about 28 times more potent than carbon dioxide over a 100-year period. Beyond methane, land clearing for grazing and feed crops adds to the footprint.
- Producing 1kg of beef generates around 27 kg of CO2e.
- Lamb is slightly lower, at around 20 kg of Coxe per kg.
- Chicken and pork fall in the 5-7 kg of CO2e per kg range.
- Plant proteins such as beans, peas, and lentils typically sit below 2 kg CO2e per kg.
This means that swapping just one beef-based meal per week for a plant-based option can save several kilograms of CO2 over the course of a year.
Food waste
Food waste is another major but avoidable source of emissions. Australia discards around 7.6 million tonnes of food annually, contributing an estimated 17.5 million tonnes of CO2e when production and landfill decomposition are accounted for. Wasted food carries a double cost: the emissions from growing, processing, and transporting it, plus the methane it releases when rotting in a landfill.
Transported and processed foods
“Food miles” — the distance food travels before reaching your plate — also add up. Flying in out-of-season produce or importing heavily processed foods increases emissions due to transport, refrigeration, and packaging. While the footprint of transport is generally smaller than production itself, buying local, seasonal produce can still make a measurable difference.
For example, fresh local apples sold in autumn carry a much smaller footprint than apples imported from overseas in summer, which require refrigeration and long-haul shipping.
Consumer habits
The way we shop and consume has a major influence on emissions, even if the connection is less visible than turning on a car engine or taking a flight. Every product we buy carries “embodied carbon” — the emissions from the extraction of raw materials, manufacturing, transport, and disposal. In wealthy countries like Australia, consumer habits make up a large share of indirect emissions, and understanding them is key to reducing overall impact.
Fast fashion
Clothing is one of the clearest examples of hidden emissions in consumer choices. The fashion industry is estimated to account for around 10% of global greenhouse gas emissions, more than aviation and shipping combined. Producing textiles is energy- and water-intensive:
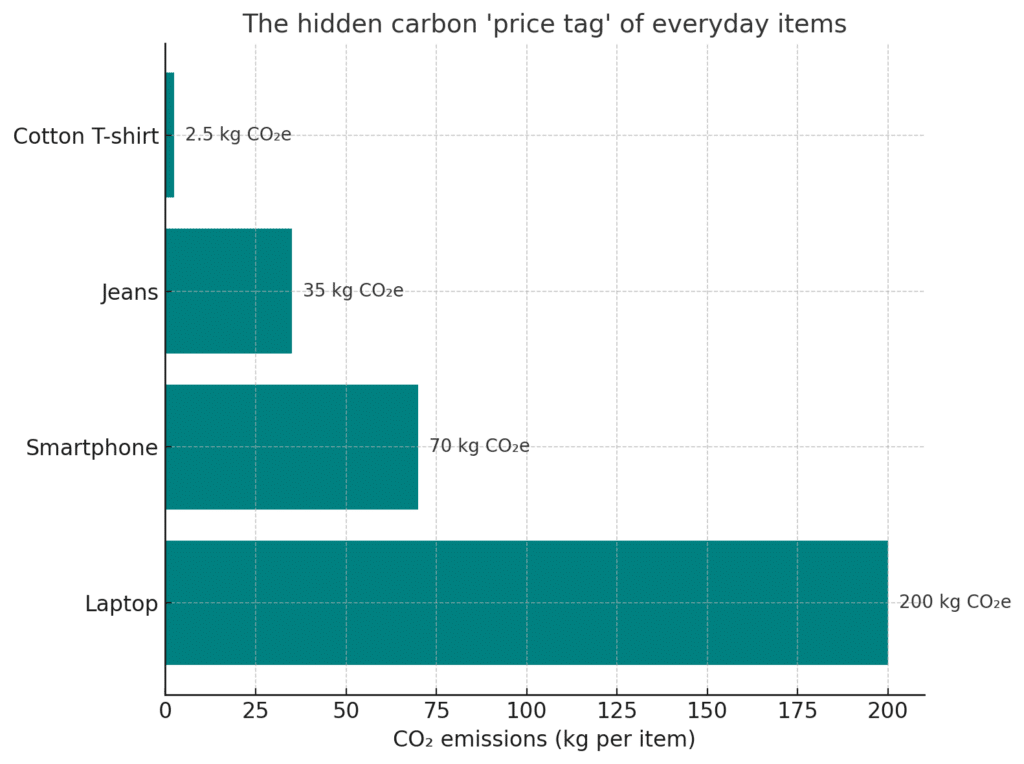
- A single cotton t-shirt has a footprint of 2.5 kg CO2e, requiring around 2,700 litres of water.
- A pair of jeans produces 30-40 kg CO2e due to cotton farming, dyeing, and finishing.
- Synthetic fabrics like polyester are made from fossil fuels and shed microplastics that persist in the environment.
The fast fashion cycle, which pertains to the use of cheap garments that are designed for short-term use, amplifies this impact. Aussies discard an estimated 200,000 tonnes of clothing every year, most of which ends up in landfill. Choosing fewer, higher-quality items and extending their lifespan is one of the most effective ways to reduce fashion-related emissions.
Electronics and appliances
Electronics are another high-footprint category due to the extraction of rare minerals, energy-intensive manufacturing, and short product lifespans.
- The average smartphone generates around 70 kg CO2e in production alone.
- A laptop can exceed 200 kg of CO2e across its manufacturing and lifecycle.
Frequent upgrades compound the issue: the emissions from making a new phone often outweigh the emissions from charging and using it over several years. Repairing, reusing, or buying refurbished devices reduces the need for new production, cutting the associated carbon footprint.
Packaging and plastics
Packaging, especially single-use plastics, contributes to emissions through petroleum-based production and poor recycling rates. Making 1 kg of plastic produces about 6 kg CO2e, and Australia generates more than 3 million tonnes of plastic waste each year. Only around 13% is recycled, meaning the majority ends up in landfill or as litter. Even recycling consumes energy, so the best option remains reducing unnecessary packaging where possible.
Reusable bags, bulk buying, and supporting businesses with minimal packaging help shift customer demand. Compostable packaging and recycled materials reduce emissions, but ultimately, reducing total consumption delivers the greatest impact.
Digital life
Most people associate carbon emissions with cars, flights, and factories, but not with Netflix, emails, or cloud storage. Yet the digital world depends on vast physical infrastructure: data centres, server farms, and undersea cables. These facilities consume enormous amounts of electricity, much of which is still drawn from fossil fuels. As more daily activities move online, the “invisible” carbon footprint of digital habits continues to grow.
Streaming and cloud storage
Video streaming is one of the biggest contributors. High-definition and 4K streams require significantly more data than standard definition. Each hour of HD streaming produces roughly 0.2-0.4 kg of CO2e, depending on the efficiency of the data centre and the electricity grid powering it. Globally, billions of hours of video are streamed each week, adding up to emissions equivalent to those of major industries.
Cloud storage also has a hidden cost. Storing thousands of photos or videos on remote servers means energy is constantly consumed to keep those files available and backed up. While the footprint per file is small, the scale of global cloud usage makes the impact meaningful.
Emails and everyday internet use
Sending a single short email carries an almost negligible footprint, around 4 g of CO2e, but this grows with file size and attachments. A large email with a 1 MB attachment can generate around 50 g of CO2e. Across billions of emails sent daily, the emissions add up to millions of tonnes every year.
Every online search, video call, or file download taps into the same energy-intensive infrastructure. For households, the direct footprint may be modest compared to transport or heating, but collectively digital life represents a growing slice of the global carbon problem.
Making digital habits more efficient
Unlike transport or diet, reducing digital emissions rarely requires big lifestyle changes. Small adjustments scale well when multiplied across millions of users:
- Stream in standard definition when HS is unnecessary.
- Delete unnecessary emails, files, and backups.
- Compress attachments before sending.
- Choose cloud providers with renewable-powered data centres.
These actions may only cut grams at a time, but across billions of users they translate into real deductions. The larger message is that “invisible” online habits are not carbon-free. They are tied to very real energy consumption and emissions.
Did You Know?
- Streaming 1 hour of HD video creates about 0.3 kg of CO₂e — the same as boiling a kettle 3–4 times.
- Deleting 1,000 unnecessary emails can save around 50 kg of CO₂e — equivalent to leaving a lightbulb on for two weeks.
- Storing 100 GB of files in the cloud for a year can emit up to 200 kg of CO₂e, depending on the provider’s energy mix.
- Switching from HD to standard definition streaming reduces emissions by up to 75%.
Waste and disposal
The way we deal with rubbish is another hidden driver of carbon emissions. While waste might feel like the end of a product’s life, it is actually just the last stage in a long chain of energy use and emissions. How we dispose of food, plastics, and other materials determines whether those emissions to stop there or continue too grow.
Landfill and methane
When organic waste such as food scraps, paper, and garden clippings ends up in a landfill, it decomposes without oxygen. This anaerobic breakdown releases methane, a greenhouse gas 28 times more potent than carbon dioxide over a century. In Australia, landfills are responsible for about 3% of national greenhouse gas emissions, nearly all of it methane. A single bag of food waste can release as much methane as driving several kilometres in a petrol car.
Recycling inefficiencies
Recycling can reduce emissions by cutting the need for virgin materials, but only when it’s done effectively. Contamination of recycling bins often means materials are rejected and end up in a landfill anyway. Even when recycling succeeds, it consumes energy, so reducing consumption in the first place has a larger carbon benefit.
For example:
- Recycling aluminium saves up to 95% of the emissions compared to producing it new.
- Recycling plastics, on the other hand, saves far less, and the majority of plastics in Australia still go to landfill.
The importance of reuse and repair
From a carbon perspective, reusing items is far more effective than recycling them. Extending the life of a garment, a phone, or an appliance avoids the emissions from producing a new replacement altogether. For instance, repairing a smartphone instead of buying a new one can avoid more than 70 kg of CO2e embedded in manufacturing.
Food waste
Food waste deserves special attention in the context of disposal. Beyond the methane it creates in landfill, every kilogram of wasted food also represents the energy, fertiliser, and water used to grow, process, and transport it. Composting, feeding scraps to animals, or diverting food to community programs all prevent waste from becoming a double carbon cost.
Water use
Water seems abundant in daily life, but the systems that deliver, heat, and treat it carry a significant carbon cost. Every litre that comes out of a tap has been pumped, filtered, and transported through energy-intensive infrastructure. Once used, wastewater must also be treated before being released back into rivers, oceans, or reused.
The carbon cost of supply
Urban water supply systems are powered by electricity. Pumps push water across long distances and up elevations, particularly in sprawling cities such as Sydney and Melbourne. On average, supplying one kilolitre (1,000 litres) of water in the country uses between 0.2 and 1.0 kWh of energy, depending on location and infrastructure. That equates to 0.3-0.9 kg of CO2e, with higher figures in coal-heavy states.
Desalination plants, which are critical in drought-prone regions, are even more energy-intensive. Producing one kilolitre of desalinated water requires 3-5 kWh of energy, making it several times more carbon-intensive than conventional sources. This means households in regions relying heavily on desalination have a larger hidden footprint tied to their water use.
Heating water
For most homes, the largest carbon impact of water use comes from heating. Showers, hot taps, and appliances account for up to 25% of the household energy use. A 10-minute hot shower consumes around 50 litres of heated water and about 2.5 kWh of electricity, which equals roughly 2 kg of CO2 emissions in a coal-heavy grid. Multiply that by daily showers across a household, and the footprint becomes substantial.
Overconsumption
Small habits like running taps while brushing teeth or using hoses to wash cars compound the issue. While each act is minor, they add to the overall demand on water systems, increasing both resources used and the energy required to keep supplies running.
The cumulative effect
One of the most common objections to changing everyday habits is that the impact of one person seems insignificant. Turning off a lightbulb, taking a shorter shower, or skipping one short car trip looks small when compared to the emissions from a coal power station or an international airline. But carbon accounting isn’t about single actions, but about how they multiply across households, communities, and nations.
Small actions, big totals
Consider the humble clothes dryer. Running it for an hour uses around 2.5 kWh of electricity. In Victoria, that equals about 2 kg of CO₂. For one household, the difference between using the dryer and line-drying seems trivial. But if every household in Australia reduced dryer use by 25%, the annual savings would exceed 1.5 million tonnes of CO₂e — roughly the same as taking 600,000 cars off the road for a year.
National scale of food waste
Food waste is another example. The average Australian household throws out about 200 kg of food annually, which equals roughly 500 kg of CO₂e when accounting for production and landfill emissions. Multiply that across Australia’s 10 million households, and food waste alone represents a climate impact larger than the emissions from the country’s domestic aviation sector.
Transport choices
Daily commutes also illustrate the multiplier effect. Driving 20 km to work in a petrol car produces about 4 kg of CO₂e. Over a year, that adds up to nearly 1 tonne of emissions per commuter. If just 1 in 10 commuters shifted to public transport, the combined annual savings would be measured in the millions of tonnes.
Why this matters
These examples show that individual actions are not symbolic gestures. They are practical contributions to a collective outcome. When scaled, even modest behavioural shifts deliver reductions that rival industrial interventions. Everyday decisions about energy, transport, food, and waste are therefore a critical part of the national emissions picture.
Carbon emissions are not only the responsibility of heavy industry or government policy. They are embedded in the way we live: in every shower taken, meal cooked, kilometre driven, or purchase made. These everyday activities, though often overlooked, collectively add up to a substantial share of Australia’s total emissions.
Recognising the carbon cost of daily choices is not about shifting blame onto individuals, but about highlighting the power of awareness. Systemic change — cleaner grids, sustainable transport, better waste systems — is essential. Yet personal and household actions provide immediate, scalable reductions that support these broader transitions.
Every avoided kilogram of carbon matters. When multiplied across millions of households, small adjustments become large outcomes: fewer cars on the road, less food in landfill, lower demand for coal-fired electricity. Everyday decisions, when informed and deliberate, contribute directly to the national pathway toward net zero by 2050.
The challenge ahead is not only technological but behavioural. By understanding where our emissions come from, Australians can align personal habits with national climate goals. The result is a double benefit: lower household costs and a lighter footprint on the planet.