


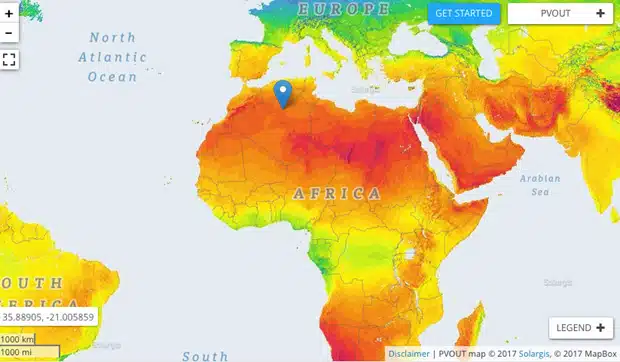
Investors and governments now have a new tool to find the best areas for solar power generation around the world.
The Global Solar Atlas is said to be the most detailed tool of its kind. It was developed by Solargis and funded by the World Bank’s Energy Sector Management Assistance Programme.
The Atlas displays the annual average for solar energy potential. It addition, it can zoom in to areas in great detail – with a spatial resolution of 1 km.
The Atlas also provides access to high resolution global and regional maps as well as geographic information system (GIS) data. This enables users to print poster maps and use the data in other applications.
A useful tool for governments and solar investors
The maps come from satellite atmospheric and meteorological data. They provide investors and solar developers with an easily accessible and uniform platform. With it, they can make comparisons between potential sites to find the best locations.
According to the World Bank, a number of Pacific Island states have committed to “significant increases” in renewable use. Solar power in particular is a growing source of energy in the region.
Andrew Daka, Executive Director of the Pacific Power Association, said the tool provides investors and governments with important data.
This will help stakeholders perform more detailed analyses, making it easier for Pacific island countries to adopt solar energy.
Access the Atlas here.
Australia’s own energy resource map
Australia has its own detailed maps for the energy industry: the Australian Renewable Energy Mapping Infrastructure (AREMI).
AREMI is a spatial data platform that shows areas of energy activity linked to data sets.
The maps display sample data from electricity network providers, indicating network constraints and planned investment.
Information available via the application includes live NEM (National Electricity Market) electricity generation. In addition, it shows maps of small scale installations of wind turbines and solar panels, plus solar power production statistics.
Furthermore, it shows up to date stats on small scale solar installations around the country. It also shows the contribution solar makes to the energy grid at different times of the day in each state.