ANU: Unveil New Tool To Help Maximise Renewable Energy Potential

The Australian National University (ANU) has launched a new heat maps tool that aims to maximise Australia’s renewable energy potential. Developed by researchers at the ANU Energy Change Institute, the tool uses data from satellite imagery and weather station measurements to identify areas of the country that have the highest potential for solar and wind energy generation.

ANU - Professor Andrew Blakers Image&Source: ANU – Professor Andrew Blakers

“In Victoria, the Yallourn district is attractive because of good wind potential and strong existing transmission into Melbourne, plus there’s a need to replace local coal industry jobs. There’s also extensive wind potential west of Melbourne,” Professor Andrew Blakers, from the ANU College of Engineering, Computing and Cybernetics, said.

“Meantime, South Australia has excellent wind and solar potential to the east of the St Vincent and Spencer gulfs, while Queensland’s best wind and solar sites follow the coastal transmission lines north from Brisbane in areas such as Rockhampton and Mackay.

“Perth, on the other hand, has an abundance of suitable solar and wind sites close to transmission lines that run from the north and the south of the city.”

ANU-PhD-Cheng-Cheng Image&Source: ANU – PhD Cheng Cheng

According to ANU PhD researcher Cheng Cheng, who was also part of the study, the project intends to empower landowners to contact developers directly and negotiate the construction of solar or wind farms on their property.

“Access to high voltage transmission lines is essential for solar, and wind farms and landholders in windy and sunny areas near existing infrastructure have a valuable economic opportunity.”

“Our heat maps are designed to facilitate collective bargaining with developers. This can also assist the solar and wind farm developers by reducing the complexity and time required to gain legal access and community acceptance.”

“If landowners or local councils are able to access this sort of information and collectively approach developers themselves, it could speed up the development process. Currently, developers approaching individual landowners may face high rejection rates.”

Map Images

GoulburnUndergroundLowSolar 
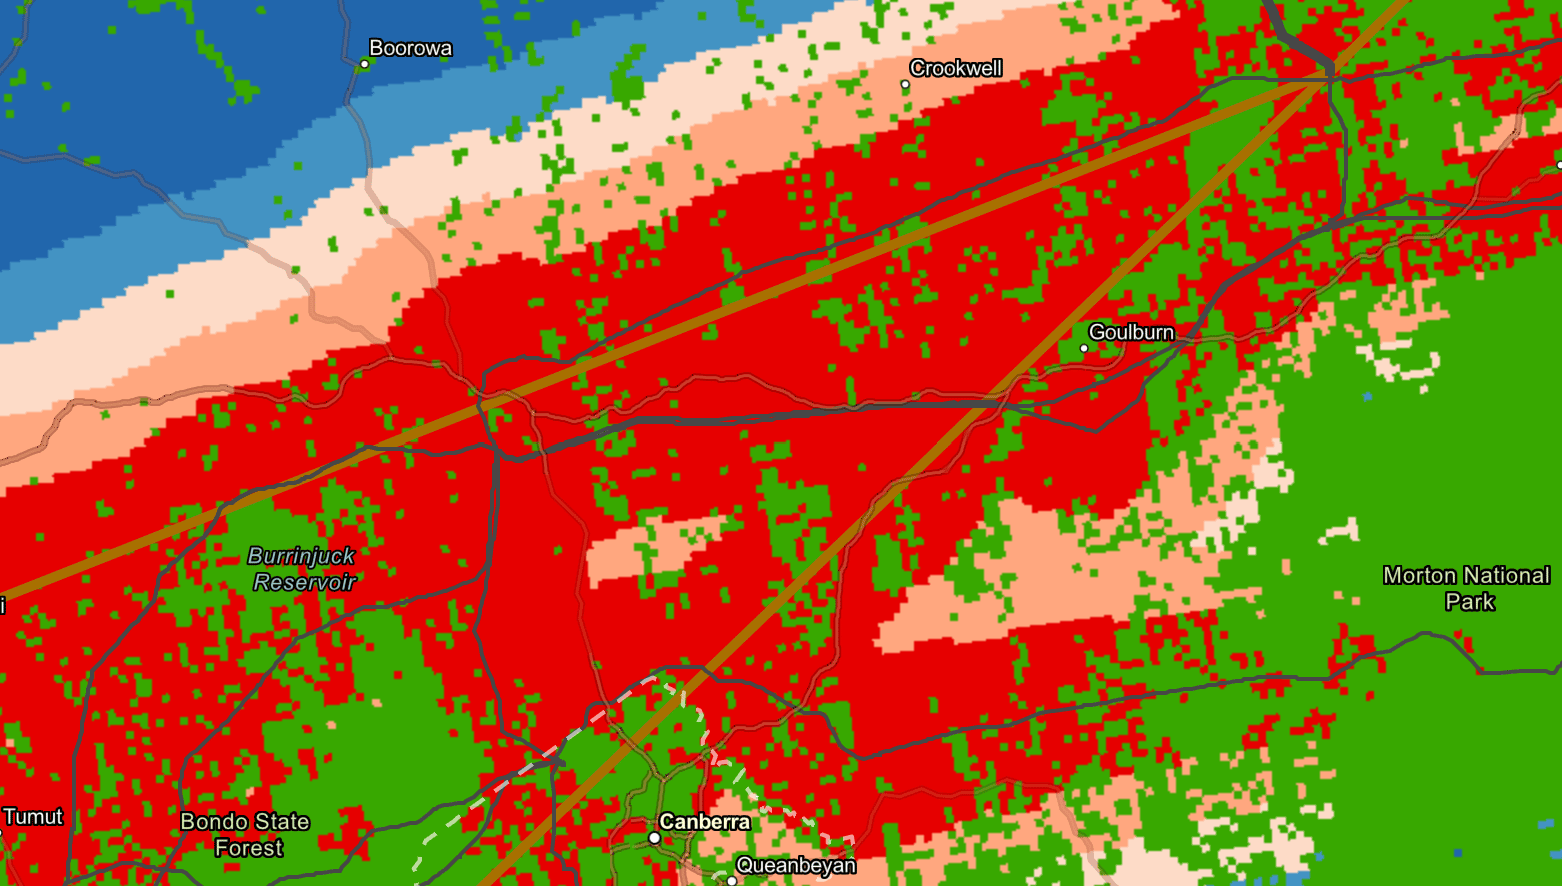
Image: ANU – Goulburn and surrounds for the low-cost solar and underground powerlines scenario

low-cost wind and overhead 
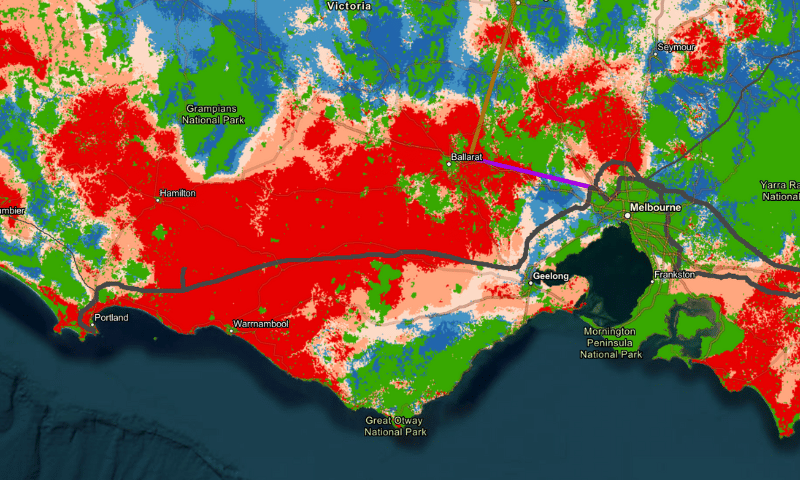
Image: ANU – Scenario with low-cost wind and overhead powerlines for Victoria

high-cost wind and underground 
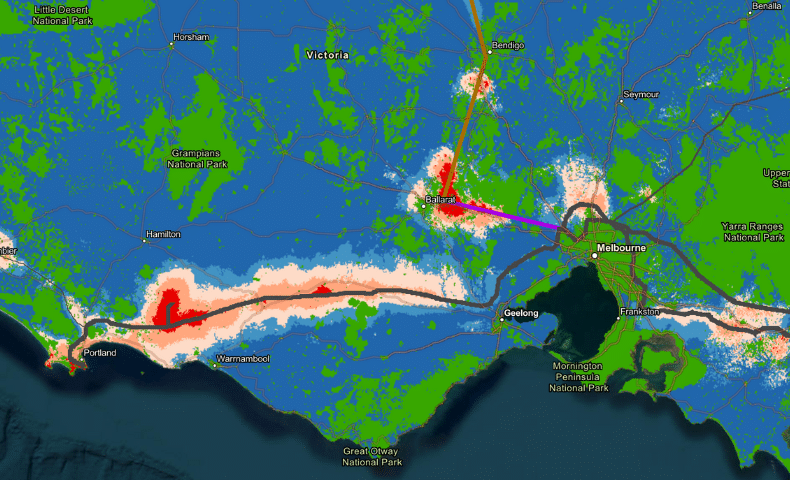
Image: ANU- Scenario with high-cost wind and underground powerlines for Victoria

An overview of the heat map tool

One of the key features of the ANU high-resolution heat maps tool is its ability to consider the specific characteristics of different regions. For example, the tool can identify areas with high solar potential in the country’s north while highlighting areas with strong wind potential in the south.

Because wind resources vary rapidly with location, the pixels are 1km by 1km for solar and 250m by 250m for wind. Users may easily zoom in by clicking on a pixel, and you can get an estimate of the relative cost of generating solar or wind electricity in that area (in $/MWh). It comprises the cost of solar or wind farm electricity and the cost of the low-voltage powerline to the nearest existing or proposed high-voltage transmission lines.

It excludes expenses for environmental and geotechnical approvals, road upgrades, substations, host farmer payments, risk, and other factors. These expenses vary substantially depending on the scope of the project. Heat-map users can add these expenditures by selecting high, medium, or low costs.

The ANU heat maps tool is the latest example of the university’s commitment to finding innovative solutions to the challenges of transitioning to a low-carbon economy. In recent years, ANU researchers have also developed a range of technologies and approaches to improve energy efficiency, reduce carbon emissions, and increase the use of renewable energy sources.

The launch of the heat maps tool comes at a time when Australia is looking to transition to a low-carbon economy and reduce its reliance on fossil fuels. With a combination of strong solar and wind potential, Australia has the potential to become a world leader in renewable energy. The ANU heat maps tool will be a valuable resource in helping the country reach this goal.


get free quote for commercial solar

Who’ll benefit from these maps?

Developers of solar and wind farms have vast knowledge and experience analysing locations. This generates a significant knowledge asymmetry when they bargain with landowners, communities, and governments.

Heat maps will assist in minimising this imbalance by empowering local governments and landowners to select eligible places.

Developers may benefit if the maps decrease the complexity and time required to secure legal access and community acceptance.

Local governments can also use these maps to identify prospective locations for multiple solar and wind farms. These state-designated renewable energy zones could help attract developers, boosting local economic activity.

The tool can be found at: https://re100.eng.anu.edu.au/heatmaps/#map-links

Energy Matters has been a leader in the renewable energy industry since 2005. Contact us, and we can connect you with our trusted local solar installers in Melbourne, who will provide up to 3 FREE quotes for your home and business solar energy system. Complete our quick quiz and begin your solar journey today!

Get a quick solar quote, or contact us today toll free on 1800 EMATTERS or email our friendly team for expert, obligation-free advice!

Other Energy Matters news services: