The United States may have decommissioned its space shuttle program, but the thousands of images of the Earth’s surface captured over three decades by astronauts are being used to build a precise solar modelling system that can help measure solar power output across California’s often rugged landscape.
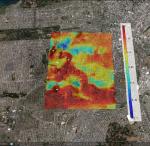
Using three-dimensional images gathered by NASA’s Shuttle Radar Topography Mission, researchers from the Jacobs School of Engineering have created a vast map that shows how changes in elevation such as hills and valleys impact on the electricity yield of solar power systems. It is the first time a publicly available large-scale solar modelling system has been developed that can assess this type of information.
According to team leader Jan Kleissl, a professor of environmental engineering at Jacobs, utilities and home owners will be able to access the solar map and get a more realistic picture of how much solar energy their system will produce based on their location.
“Solar resource models have become very accurate,” he says. “Now we are refining them down to the last few percentage points.”
Working at the behest of the California Public Utilities Commission, the Jacobs team commandeered the Triton Supercomputer at the University of San Diego. The system ran 60,000 processing-hours of calculations using elevation data obtained on a near-global scale by astronauts aboard the space shuttle Endeavour during an 11-day mission in February 2000.
They then compiled a high-resolution digital database of areas of California where most solar power plants are located and where elevation is an issue, namely the San Francisco Bay Area and Southern California.
Changes in elevation have serious implications for the location of solar energy projects. Solar days are longest on the top of tall mountains where sun exposure is uninterrupted from dawn until dusk. In hilly terrain, the “local horizon” means the sun takes longer to rise in the morning and sets earlier in the evening, resulting in a loss of “solar fuel.”
The horizon data will be made available as a simulation option in Clean Power Research’s SolarAnywhere product line as early as the first quarter of 2012. The horizon data (50 GB of csv files) will also be publicly available at the California Solar Initiative website and upon request from jkleissl@ucsd.edu.
Australians need not feel totally left out. While not as high-tech, national solar solutions provider Energy Matters offers a free Solar Analyser, which provides full solar site analysis and generates a realistic estimation of the kilowatt hours of solar electricity that can be generated at a location.
Additionally, the Queensland government recently unveiled the Queensland Solar Atlas, an online tool designed to assist companies in identifying the best areas for potential future solar power generation projects.


